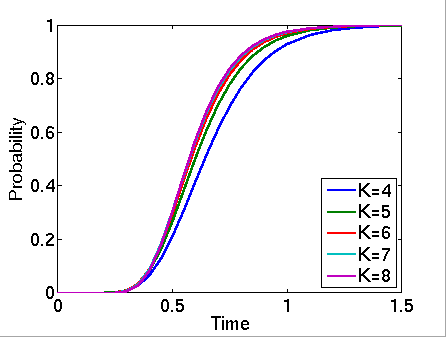
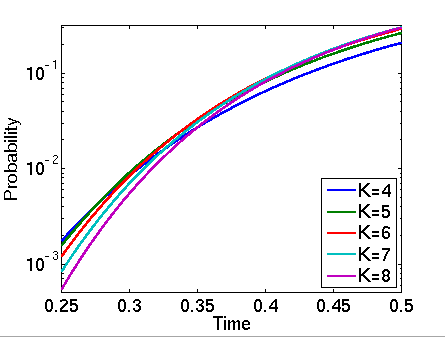
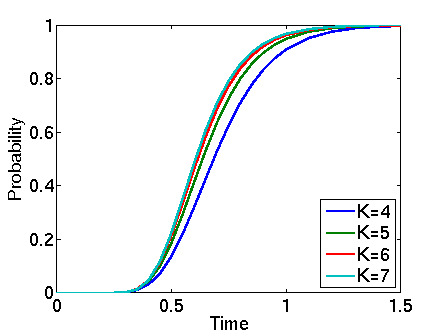
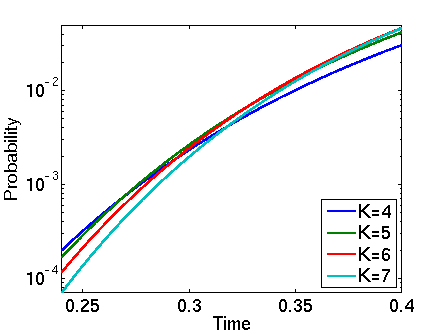
This case study describes a simple peer-to-peer protocol based on BitTorrent. The model comprises a set of clients trying to download a file that has been partitioned into K blocks. Initially, there is one client that has already obtained all of the blocks and N additional clients with no blocks. Each client can download a block from any of the others but they can only attempt four concurrent downloads for each block.
Our model is represented as a CTMC. The PRISM source code for this case study (when N=4 and K=5) is given below.
// Simple peer-to-peer file distribution protocol based on BitTorrent
// gxn/dxp Jan 2006

ctmc

// N=4 clients, K=5 blocks to be downloaded
// Actually there are N+1=5 clients, one of which has all blocks initially

// Rate of block download for a single source
const double mu=2;

// Rate of download of block i:
// A client can download from the single client which starts with all blocks
// or from anyone that has subsequently downloaded it.
// Total number of concurrent downloads for each block is 4.
formula rate1=mu*(1+min(3,b11+b21+b31+b41));
formula rate2=mu*(1+min(3,b12+b22+b32+b42));
formula rate3=mu*(1+min(3,b13+b23+b33+b43));
formula rate4=mu*(1+min(3,b14+b24+b34+b44));
formula rate5=mu*(1+min(3,b15+b25+b35+b45));

// client 1
module client1

	// bij - has client i downloaded block j yet?
	b11 : [0..1];
	b12 : [0..1];
	b13 : [0..1];
	b14 : [0..1];
	b15 : [0..1];

	// Downloading of each block (see rate computations above)
	[] b11=0 -> rate1 : (b11'=1);
	[] b12=0 -> rate2 : (b12'=1);
	[] b13=0 -> rate3 : (b13'=1);
	[] b14=0 -> rate4 : (b14'=1);
	[] b15=0 -> rate5 : (b15'=1);

endmodule

// construct remaining clients through renaming
module client2=client1[b11=b21,b12=b22,b13=b23,b14=b24,b15=b25,b21=b11,b22=b12,b23=b13,b24=b14,b25=b15] endmodule
module client3=client1[b11=b31,b12=b32,b13=b33,b14=b34,b15=b35,b31=b11,b32=b12,b33=b13,b34=b14,b35=b15] endmodule
module client4=client1[b11=b41,b12=b42,b13=b43,b14=b44,b15=b45,b41=b11,b42=b12,b43=b13,b44=b14,b45=b15] endmodule

// labels
label "done1" = b11+b12+b13+b14+b15 = 5; // client 1 has received all blocks
label "done2" = b21+b22+b23+b24+b25 = 5; // client 2 has received all blocks
label "done3" = b31+b32+b33+b34+b35 = 5; // client 3 has received all blocks
label "done4" = b41+b42+b43+b44+b45 = 5; // client 4 has received all blocks
label "done" = (b11+b12+b13+b14+b15)+(b21+b22+b23+b24+b25)+(b31+b32+b33+b34+b35)+(b41+b42+b43+b44+b45) = 20; // all clients have received all blocks

// reward: fraction of blocks received
rewards "frac_rec"
	true : ((b11+b12+b13+b14+b15)/5)/4;
	true : ((b21+b22+b23+b24+b25)/5)/4;
	true : ((b31+b32+b33+b34+b35)/5)/4;
	true : ((b41+b42+b43+b44+b45)/5)/4;
endrewards
The table below gives information about the CTMC representing the model: the number of states and the number of transitions.
| N: | K: | Model: | |||||||
| States: | Transitions: | ||||||||
| 4 | 4 | 65,536 | 524,288 | ||||||
| 5 | 1,048,576 | 10,485,760 | |||||||
| 6 | 16,777,216 | 201,326,592 | |||||||
| 7 | 268,435,456 | 3,758,096,384 | |||||||
| 8 | 4,294,967,296 | 68,719,476,736 | |||||||
| 5 | 4 | 1,048,576 | 10,485,760 | ||||||
| 5 | 33,554,432 | 419,430,400 | |||||||
| 6 | 1,073,741,824 | 16,106,127,360 | |||||||
| 7 | 34,359,738,368 | 601,295,421,440 | |||||||
The table below gives the times taken to construct the models. This process involves first building a CTMC (represented as an MTBDD) from the system description (in our module based language), and then computing the reachable states using a BDD based fixpoint algorithm. The total time required and the number of fixpoint iterations are given below.
| N: | K: | Model: | |||||||
| Time (s): | Iter.s: | ||||||||
| 4 | 4 | 17 | 0.00 | ||||||
| 5 | 21 | 0.01 | |||||||
| 6 | 25 | 0.01 | |||||||
| 7 | 29 | 0.02 | |||||||
| 8 | 33 | 0.02 | |||||||
| 5 | 4 | 21 | 0.00 | ||||||
| 5 | 26 | 0.01 | |||||||
| 6 | 31 | 0.02 | |||||||
| 7 | 36 | 0.03 | |||||||
We have model checked the following property:
The corresponding CSL formula is given by:
const double T; // time bound

// probability that all clients have received all blocks by time T
P=? [ true U<=T  "done"  ]

// expected fraction of blocks received by time T
R=? [ I=T ]
In the graphs below we have plotted these probabilities from a range of values of T.


