
(Haverkort, Hermanns & Katoen)
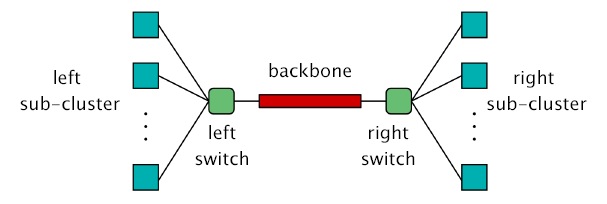
This case study is based on a cluster of workstations, taken from [HHK00]. The system comprises two sub-clusters with N workstations in each, connected in a star topology. The switches connecting each sub-cluster are joined by a central backbone. All components can break down and there is a single repair unit to service all components.
We define two levels of Quality of Service (QoS):
The model is represented as a CTMC. The PRISM source code is given below.
// Workstation cluster [HHK00]
// dxp/gxn 11/01/00

ctmc

const int N; // Number of workstations in each cluster
const int left_mx = N; // Number of work stations in left cluster
const int right_mx = N; // Number of work stations in right cluster

// Minimum QoS requires 3/4 connected workstations operational
const int k = floor(0.75*N);
formula minimum = (left_n>=k & toleft_n) |
                  (right_n>=k & toright_n) |
                  ((left_n+right_n)>=k & toleft_n & line_n & toright_n);

// Failure rates
const double ws_fail = 1/500; // Single workstation: average time to fail = 500 hrs
const double switch_fail = 1/4000; // Switch: average time to fail = 4000 hrs
const double line_fail = 1/5000; // Backbone: average time to fail = 5000 hrs

// Left cluster
module Left

	left_n : [0..left_mx] init left_mx; // Number of workstations operational
	left : bool; // Being repaired?

	[startLeft] !left & (left_n<left_mx) -> 1 : (left'=true);
	[repairLeft] left & (left_n<left_mx) -> 1 : (left'=false) & (left_n'=left_n+1);
	[] (left_n>0) -> ws_fail*left_n : (left_n'=left_n-1);

endmodule

// Right cluster
module Right = Left[left_n=right_n,
                    left=right,
                    left_mx=right_mx,
                    startLeft=startRight,
                    repairLeft=repairRight ]
endmodule

// Repair unit
module Repairman

	r : bool; // Repairing?

	[startLeft]    !r -> 10 : (r'=true); // Inspect Left
	[startRight]   !r -> 10 : (r'=true); // Inspect Right
	[startToLeft]  !r -> 10 : (r'=true); // Inspect ToLeft
	[startToRight] !r -> 10 : (r'=true); // Inspect ToRight
	[startLine]    !r -> 10 : (r'=true); // Inspect Line

	[repairLeft]    r -> 2     : (r'=false); // Repair Left
	[repairRight]   r -> 2     : (r'=false); // Repair Right
	[repairToLeft]  r -> 0.25  : (r'=false); // Repair ToLeft
	[repairToRight] r -> 0.25  : (r'=false); // Repair ToRight
	[repairLine]    r -> 0.125 : (r'=false); // Repair Line

endmodule

// Line/backbone
module Line

	line :   bool; // Being repaired?
	line_n : bool init true; // Working?

	[startLine] !line & !line_n -> 1 : (line'=true);
	[repairLine] line & !line_n -> 1 : (line'=false) & (line_n'=true);
	[] line_n -> line_fail : (line_n'=false);

endmodule

// Left switch
module ToLeft = Line[line=toleft,
                     line_n=toleft_n,
                     line_fail=switch_fail,
                     startLine=startToLeft,
                     repairLine=repairToLeft ]
endmodule

// Right switch
module ToRight = Line[line=toright,
                      line_n=toright_n,
                      line_fail=switch_fail,
                      startLine=startToRight,
                      repairLine=repairToRight ]
endmodule

// Reward structures

// Percentage of operational workstations stations
rewards "percent_op"
	true : 100*(left_n+right_n)/(2*N);
endrewards

// Time that the system is not delivering at least minimum QoS
rewards "time_not_min"
	!minimum : 1;
endrewards

// Number of repairs
rewards "num_repairs"
	[repairLeft]    true : 1;
	[repairRight]   true : 1;
	[repairToLeft]  true : 1;
	[repairToRight] true : 1;
	[repairLine]    true : 1;
endrewards
The table below shows statistics for each model we have built. The first section gives information about the CTMC representing the model: the number of states and the number of non zeros (transitions). The second part refers to the MTBDD which represents this CTMC: the total number of nodes, the number of leaves (terminal nodes), and the amount of memory needed to store it. The last column gives the amount of memory a sparse matrix would need to represent the same CTMC.
| N: | Model: | MTBDD: | Sparse: | ||||||
| States: | NNZ: | Nodes: | Leaves: | Kb: | Kb: | ||||
| 2 | 276 | 1,120 | 331 | 9 | 6.46 | 16.4 | |||
| 4 | 820 | 3,616 | 535 | 11 | 10.5 | 51.9 | |||
| 8 | 2,772 | 12,832 | 968 | 15 | 18.9 | 183 | |||
| 16 | 10,132 | 48,160 | 1,899 | 23 | 37.1 | 683 | |||
| 32 | 38,676 | 186,400 | 3,906 | 39 | 76.3 | 2,637 | |||
| 64 | 151,060 | 733,216 | 8,225 | 71 | 160 | 10,362 | |||
| 128 | 597,012 | 2,908,192 | 17,481 | 134 | 341 | 41,076 | |||
| 256 | 2,373,652 | 1.15e+7 | 37,272 | 262 | 728 | 162,581 | |||
| 512 | 9,465,876 | 4.6e+7 | 79,399 | 518 | 1,550 | 649,990 | |||
The table below gives the times taken to construct the models. This process involves first building a CTMC (represented as an MTBDD) from the system description (in our module based language), and then computing the reachable states using a BDD based fixpoint algorithm. The total time required and the number of fixpoint iterations are given below.
| N: | Construction: | ||
| Time (s): | Iter.s: | ||
| 2 | 0.14 | 9 | |
| 4 | 0.15 | 13 | |
| 8 | 0.20 | 21 | |
| 16 | 0.05 | 37 | |
| 32 | 0.12 | 69 | |
| 64 | 1.65 | 133 | |
| 128 | 6.20 | 261 | |
| 256 | 23.43 | 517 | |
| 512 | 100.96 | 1,029 | |
The table below gives the times taken to compute the steady-state probabilities using the JOR method.
The number of iterations required and the time taken using the MTBDD, sparse and hybrid engines is as follows.
| N: | Time per iteration: (s) | Iterations: | |||
| MTBDD | Sparse | Hybrid | |||
| 2 | 0.028 | 0.00026 | 0.00027 | 39 | |
| 4 | 0.052 | 0.00031 | 0.00063 | 64 | |
| 8 | 0.21 | 0.00085 | 0.0022 | 82 | |
| 16 | 0.78 | 0.0035 | 0.0072 | 141 | |
| 32 | 2.81 | 0.014 | 0.025 | 260 | |
| 64 | 9.38 | 0.14 | 0.16 | 540 | |
| 128 | 32.6 | 0.39 | 0.49 | 1,276 | |
| 256 | - | - | 2.16 | 3,634 | |
| 512 | - | - | 8.99 | 30,476 | |
The steady-state probabilities allows use to compute properties such as:
We have model checked the following properties:
"The system will always be able to offer premium QoS at some point in the future." The corresponding CSL formula is given by:
Model checking times:
| N: | Prob1 precomputation: | ||
| Time (s): | Iterations: | ||
| 2 | 0.063 | 18 | |
| 4 | 0.075 | 26 | |
| 8 | 0.073 | 42 | |
| 16 | 0.192 | 74 | |
| 32 | 0.360 | 138 | |
| 64 | 1.27 | 266 | |
| 128 | 3.30 | 522 | |
| 256 | 12.1 | 1034 | |
| 512 | 44.3 | 2058 | |
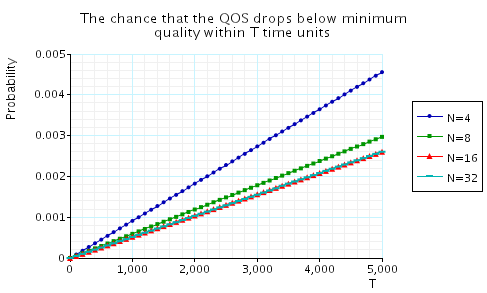
"The chance that the QoS drops below minimum quality within T time units." The corresponding CSL formula is given by
In the graph below we have plotted these probabilities from a range of values of T and N.
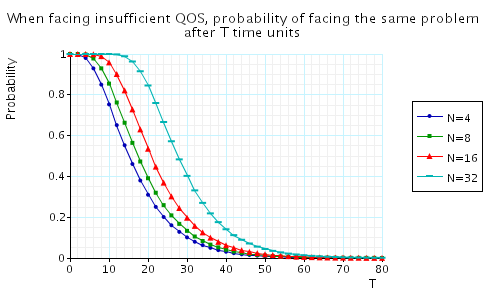
"When facing insufficient QoS, the (maximum) probability of facing the same problem after T time units." The corresponding CSL formula is given by
In the graph below we have plotted these probabilities from a range of values of T and N.
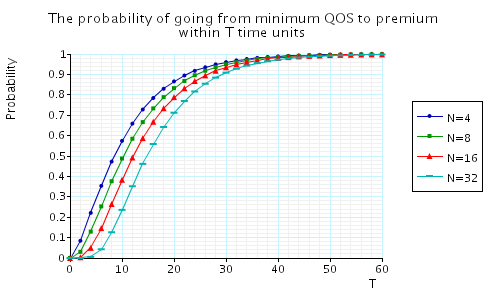
"The probability of going from minimum QoS to premium QoS within T time units." The corresponding CSL formula is given by
In the graph below we have plotted these probabilities from a range of values of T and N.
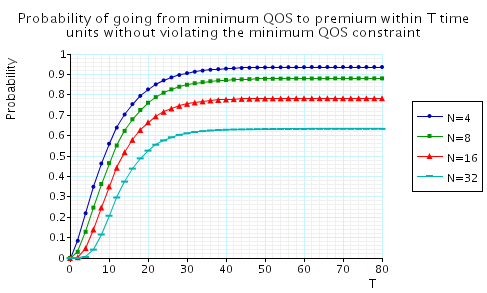
"The probability of going from minimum QoS to premium QoS within T time units without violating the minimum QoS constraint along the way." The corresponding CSL formula is given by
In the graph below we have plotted these probabilities from a range of values of T and N.
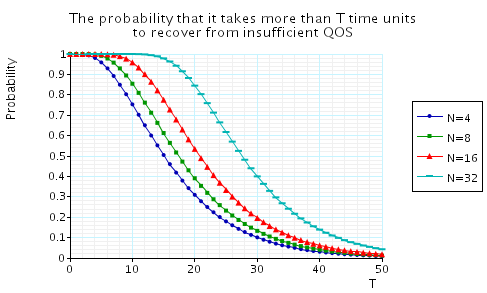
"The probability that it takes more than T time units to recover from insufficient QoS." The corresponding CSL formula is given by
In the graph below we have plotted these probabilities from a range of values of T and N.
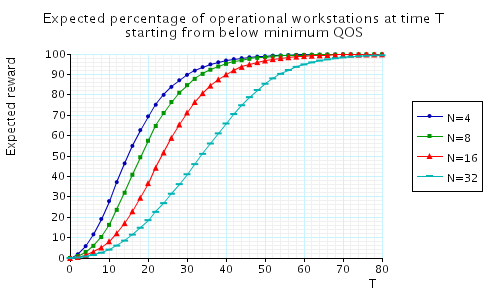
"The minimum percentage of operational workstations at time T when starting from below minimum QoS." The corresponding CSL formula is given by
In the graph below we have plotted these results from a range of values of T and N.
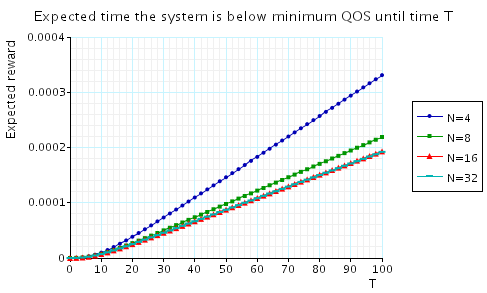
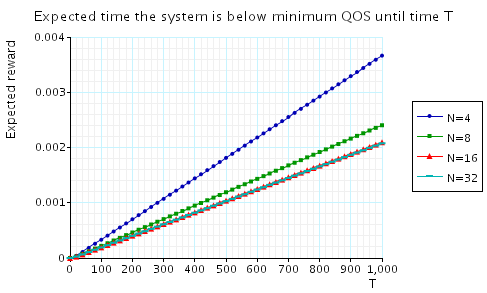
"The expected time that the system is below minimum QoS until time T." The corresponding CSL formula is given by
In the graph below we have plotted these results from a range of values of T and N.
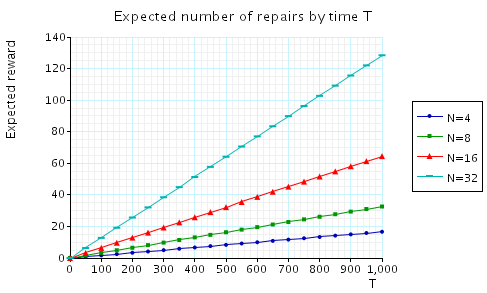
"The expected number of repairs by time T." The corresponding CSL formula is given by
In the graph below we have plotted these results from a range of values of T and N.