

If you haven't done so already, download and install PRISM.
Our first example is a PRISM model of a simple probabilistic algorithm due to Knuth and Yao [KY76]. for emulating a 6-sided die with a fair coin. Here is a graphical illustration of the algorithm:
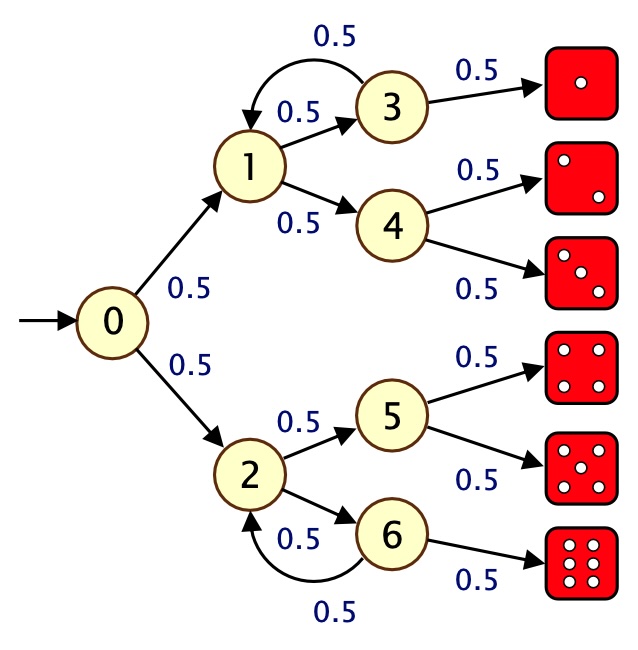
The idea of the algorithm is as follows. Starting from step 0 (i.e. the circle labelled 0), at every step a coin is tossed and there is 50% chance of taking each of the two possible choices. The algorithm terminates when you reach one of the values for the die on the right-hand side.
The PRISM code to model this algorithm is shown below.
dtmc

module die

	// local state
	s : [0..7] init 0;
	// value of the die
	d : [0..6] init 0;

	[] s=0 -> 0.5 : (s'=1) + 0.5 : (s'=2);
	[] s=1 -> 0.5 : (s'=3) + 0.5 : (s'=4);
	[] s=2 -> 0.5 : (s'=5) + 0.5 : (s'=6);
	[] s=3 -> 0.5 : (s'=1) + 0.5 : (s'=7) & (d'=1);
	[] s=4 -> 0.5 : (s'=7) & (d'=2) + 0.5 : (s'=7) & (d'=3);
	[] s=5 -> 0.5 : (s'=7) & (d'=4) + 0.5 : (s'=7) & (d'=5);
	[] s=6 -> 0.5 : (s'=2) + 0.5 : (s'=7) & (d'=6);
	[] s=7 -> (s'=7);

endmodule
The first line indicates that this model is a discrete-time Markov chain (DTMC). The remaining lines describe a single PRISM module, which we use to model the behaviour of the algorithm. We use two variables to represent the state of the system: s, denoting which step of the algorithm is currently being executed (i.e. which circle in the diagram above), and d, denoting the value of the die (0 means no value has been chosen yet).
 Read the sections on
modules/variables and
commands
in the manual and try to understand how this description represents the algorithm.
Read the sections on
modules/variables and
commands
in the manual and try to understand how this description represents the algorithm.
Download the model file die.pm for this example from the link above.
Launch the PRISM GUI
(click the shortcut on Windows or run bin/xprism elsewhere)
and load this file using the "Model | Open model" menu option.
You should see a green tick in the top left corner indicating that the model was loaded successfully.
Click on the "Simulator" tab at the bottom of the GUI.
You can now use the
simulator
to explore the model.
Create a new path by double-clicking on the main part of the window
(or right-clicking and selecting "New path").
Then, use the "Simulate" button repeatedly to generate a sample execution of the algorithm.
Look at the trace displayed in the main part of the window.
What is the final value of s?
It should be 7. What is the value of the die?
Right-click and select "Reset path".
Then, step through a trace of the algorithm manually
by double-clicking the available transitions
from the "Manual exploration" box.
Try to reach a state where the value of the die is 6.
Now change the value of the "Steps" option under the "Simulate" button from 1 to 20
and, using the "Reset path" option and "Simulate" buttons,
generate several different random traces.
What is the minimum path length you observe? What is the maximum?
We will now use PRISM to perform some analysis of the model.
Download the properties file die.pctl below and then
load it into PRISM using the "Properties | Open properties list" menu option.
const int x;

P=? [ F s=7 & d=x ]
The file comprises a constant x, whose value we leave undefined, and one property. The property is of the form P=? [ F phi ] which, intuitively, means "what is the probability, from the initial state of the model, of reaching a state where phi is true?"
What does phi mean in this case?
What does the property mean?
Right click on the property in the GUI and select "Verify".
Pick a value of x between 1 and 6 and select "OK".
Is the answer as you expected?
Click on the "Log" tab to see some additional information that PRISM has displayed regarding the calculations performed.
Open the PRISM options panel from the menu.
Find the "Termination epsilon" parameter and change it from 1.0e-6 to 1.0e-10.
Re-verify the property and see how the answer changes.
Check the log again and see many more iterations were required.
Reset the "Termination epsilon" parameter to 1.0e-6.
Read the section in the PRISM manual describing
experiments.
Use PRISM to plot a graph of the value of the property
P=? [ F phi ]
for values of x between 0 and 7.
PRISM also has a discrete-event simulation engine which can be used to generate approximate verification results (this is often called statistical model checking). This engine is also what underlies the simulator that you used earlier to explore the model manually.
Re-run your experiment using the simulator by ticking the "Use Simulation" option in the experiment dialog.
On the "New Graph Series" dialog, choose to display the results on your existing graph.
In the next dialog, which shows parameters for the simulation process,
you will see that the default number of samples is set to 1000.
Change the number of samples to 10
(if the field is not editable, select a different option from the "Automatically calculate" drop-down menu).
How are good are these approximate results?
Keep re-running the experiment, plotting the results on the same graph each time,
and changing the number of samples to 100, 1000, etc.
How many samples do you need to get results close to those generated through verification?
You can drag a box on the graph to zoom in and compare the plots more easily.
If you want to change the legend or other propeties of the graph, right-click and select "Graph options". You can also export or print the graph from this menu.
We will now use PRISM to compute the expected number of steps that the algorithm being modelled requires to generate a value for the die.
Before you do this, can you compute the result by hand?
You need to add some costs to the model.
In PRISM, we use the terminology "reward", rather than "cost". The two are synonomous.
Go to the "Model" tab of the PRISM GUI and add the following code to the end of the model.
rewards "steps"
	true : 1;
endrewards
This associates a reward of 1 with every state in the model.
Go back to the simulator and generate a random path through the model.
You will see that the reward for each state is now displayed in the table.
Right-click on the path, choose "Configure view" and, from the "Reward visibility" tab,
add the item labelled "cumulative" to the list of visible items
by selecting it from the right-hand panel an clicking the left arrow.
Create another path in the simulator and you will see that the accumulation
of rewards along a path are now also displayed.
We will now use PRISM to compute the expected number of steps. This can be done with a property of the form:
R=? [ F phi ]
which means "what is the expected value of the rewards cumulated, from the initial state of the model, until we reach a state satisfying phi?''.
What should phi be in order to compute
the expected number of steps that the algorithm requries to compute a value for the die?
Go to the "Properties" tab, add this new property to the list of properties, and then verify it.
What is the result? The precise answer is 11/3.
If you get a result of infinity, you have not got the right expression for phi
(take a look at this question
to see why the reward might be infinite).
[ Back to index ]