
Related publications: This example is a simpler version of the one appearing in [KNPV09].
This case study concerns a virus infecting a network. The network is a grid of N by N nodes with each node connected to four neighbours (the nodes that are above, below, to the left and to the right), except for the nodes on the border for which some of the neighbours are not present.
We model the situation in which the virus spawns/multiplies. That is, once a node is infected, the virus remains at that node and repeatedly tries to infect any of the neighbouring nodes while they remain uninfected. More precisely, once a node becomes infected, the virus can attack any of the neighbouring nodes by first trying to pass through the neighbour's firewall and, if successful, then trying to infect the neighbour. The model is based on the DTMC and CTMC models presented in [PHW05, KNLM05] although there are a number of differences between these approaches.
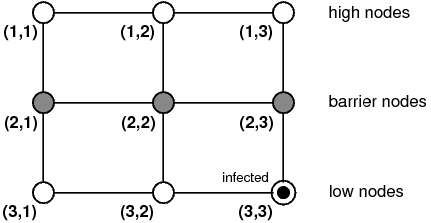
We suppose that in the network there are 'low' and 'high' nodes and that these nodes are divided by 'barrier' nodes which scan the traffic between the 'high' nodes from the 'low' nodes and that initially only one corner 'low' node is infected. A graphical representation of the network when N=3 is given below.
We suppose that both the events of the virus entering a node and infecting a node are stochastic, in that, for both these steps, there is both a chance of success and of failure. More precisely, there is both a probability that the virus may be detected by a node's firewall and a probability that when a the virus tries to infect a node it is successful (i.e. not quarantined by the node's local software).
On the other hand, we suppose that the choice as to which node the virus attempts to infect next (out of neighbouring nodes that are not infected) is nondeterministic. Note that the actual choice as to which node to infect next could depend on the precise topology of nodes present in the network; for example, the choice may be based on that fact that some of the neighbouring nodes are closer than others, because the virus is following some route, or because the virus tries to attack certain types of nodes first.
We suppose that the probability of infection equals 0.5 for all node types and the probability of detection by the firewall of the 'low' and 'high' nodes also equals 0.5. The probability of detection by the 'barrier' nodes will be varied in the analysis, and is therefore left unspecified in the model.
The PRISM model for the three node network is given below.
// virus example
// gxn/dxp 29/06/2007
// network is grid of size N

mdp

// probabilities
const double infect=0.5; // probability virus infects a node
const double detect1=0.5; // probability virus detected by firewall of high/low node
const double detect2; // probability virus detected by firewall of barrier node

// low nodes (those above the ceil(N/2) row)

const double detect11=detect1;
const double detect12=detect1;
const double detect13=detect1;

// barrier nodes (those in the ceil(N/2) row)

const double detect21=detect2;
const double detect22=detect2;
const double detect23=detect2;

// high nodes (those below the ceil(N/2) row)

const double detect31=detect1;
const double detect32=detect1;
const double detect33=detect1;

// first column (1..N)
module n11

	s11 : [0..2]; // node uninfected
	// 0 - node uninfected
	// 1 - node uninfected but firewall breached
	// 2 - node infected

	// firewall attacked (from an infected neighbour)
	[attack11_21] (s11=0) ->  detect11 : true + (1-detect11) : (s11'=1);
	[attack11_12] (s11=0) ->  detect11 : true + (1-detect11) : (s11'=1);
	// if the firewall has been breached tries to infect the node
	[] (s11=1) -> infect : (s11'=2) + (1-infect) : (s11'=0);
	// if the node is infected, then it tries to attack its neighbouring nodes
	[attack21_11] (s11=2) -> true;
	[attack12_11] (s11=2) -> true;

endmodule

module n21

	s21 : [0..2]; // node uninfected
	// 0 - node uninfected
	// 1 - node uninfected but firewall breached
	// 2 - node infected

	// firewall attacked (from an infected neighbour)
	[attack21_31] (s21=0) -> detect21 : true + (1-detect21) : (s21'=1);
	[attack21_22] (s21=0) -> detect21 : true + (1-detect21) : (s21'=1);
	[attack21_11] (s21=0) -> detect21 : true + (1-detect21) : (s21'=1);
	// if the firewall has been breached tries to infect the node
	[] (s21=1) -> infect : (s21'=2) + (1-infect) : (s21'=0);
	// if the node is infected, then it tries to attack its neighbouring nodes
	[attack31_21] (s21=2) -> true;
	[attack22_21] (s21=2) -> true;
	[attack11_21] (s21=2) -> true;

endmodule

module n31=n11[s11=s31,detect11=detect31,attack21_11=attack21_31,attack12_11=attack32_31,attack11_21=attack31_21,attack11_12=attack31_32] endmodule

// second column
module n12=n21[s21=s12,detect21=detect12,attack31_21=attack13_12,attack22_21=attack22_12,attack11_21=attack11_12,attack21_31=attack12_13,attack21_22=attack12_22,attack21_11=attack12_11] endmodule

module n22

	s22 : [0..2]; // node uninfected
	// 0 - node uninfected
	// 1 - node uninfected but firewall breached
	// 2 - node infected

	// firewall attacked (from an infected neighbour)
	[attack22_32] (s22=0) -> detect22 : true + (1-detect22) : (s22'=1);
	[attack22_23] (s22=0) -> detect22 : true + (1-detect22) : (s22'=1);
	[attack22_12] (s22=0) -> detect22 : true + (1-detect22) : (s22'=1);
	[attack22_21] (s22=0) -> detect22 : true + (1-detect22) : (s22'=1);
	// if the firewall has been breached tries to infect the node
	[] (s22=1) -> infect : (s22'=2) + (1-infect) : (s22'=0);
	// if the node is infected, then it tries to attack its neighbouring nodes
	[attack32_22] (s22=2) -> true;
	[attack23_22] (s22=2) -> true;
	[attack12_22] (s22=2) -> true;
	[attack21_22] (s22=2) -> true;

endmodule

module n32=n21[s21=s32,detect21=detect32,attack31_21=attack33_32,attack22_21=attack22_32,attack11_21=attack31_32,attack21_31=attack32_33,attack21_22=attack32_22,attack21_11=attack32_31] endmodule

// columns 3..N-1

// column N
module n13=n11[s11=s13,detect11=detect13,attack21_11=attack23_13,attack12_11=attack12_13,attack11_21=attack13_23,attack11_12=attack13_12] endmodule
module n23=n21[s21=s23,detect21=detect23,attack31_21=attack33_23,attack22_21=attack22_23,attack11_21=attack13_23,attack21_31=attack23_33,attack21_22=attack23_22,attack21_11=attack23_13] endmodule

module n33

	s33 : [0..2] init 2; // node infected;
	// 0 - node uninfected
	// 1 - node uninfected but firewall breached
	// 2 - node infected

	// firewall attacked (from an infected neighbour)
	[attack33_32] (s33=0) ->  detect33 : true + (1-detect33) : (s33'=1);
	[attack33_23] (s33=0) ->  detect33 : true + (1-detect33) : (s33'=1);
	// if the firewall has been breached tries to infect the node
	[] (s33=1) -> infect : (s33'=2) + (1-infect) : (s33'=0);
	// if the node is infected, then it tries to attack its neighbouring nodes
	[attack32_33] (s33=2) -> true;
	[attack23_33] (s33=2) -> true;

endmodule

// reward structure (number of attacks)
rewards "attacks"

	// corner nodes

	[attack11_12] true : 1;
	[attack11_21] true : 1;
	[attack31_21] true : 1;
	[attack31_32] true : 1;
	[attack13_12] true : 1;
	[attack13_23] true : 1;
	[attack33_32] true : 1;
	[attack33_23] true : 1;

	// edge nodes

	[attack12_13] true : 1;
	[attack12_11] true : 1;
	[attack12_22] true : 1;
	[attack21_31] true : 1;
	[attack21_11] true : 1;
	[attack21_22] true : 1;
	[attack32_33] true : 1;
	[attack32_31] true : 1;
	[attack32_22] true : 1;
	[attack23_33] true : 1;
	[attack23_13] true : 1;
	[attack23_22] true : 1;

	// middle nodes

	[attack22_32] true : 1;
	[attack22_23] true : 1;
	[attack22_12] true : 1;
	[attack22_21] true : 1;

endrewards
We analyse the chance and time that it takes for the virus to spread from the single infected node with grid position (N,N) to the farthest corner of the network, i.e. to the grid position (1,1). More precisely, we consider:
These property can be computed by PRISM through the following specifications:
// eventually node 11 is infected
Pmin=?[F s11=2]

//probability node 11 is infected within k steps
const int k;
Pmin=?[ F<=k s11=2]
Pmax=?[ F<=k s11=2]

// expected number of attacks before node 11 is infected
R{"attacks"}min=?[F s11=2]
R{"attacks"}max=?[F s11=2]
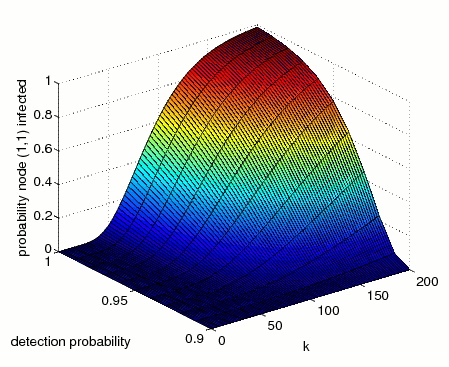
The minimum and maximum probability that the node at grid position (1,1) becomes infected.
Model checking this property demonstrates that, if firewalls of the barrier nodes are completely secure (the probability of detection for the barrier nodes equals 1), then the virus cannot pass from the `low' nodes to the `high' nodes, and hence, the minimum probability of the node in grid position (1,1) becoming infected is 0. On the other hand, if this detection probability is greater than 0, then with probability 1 the virus will eventually infect all the 'high' nodes.
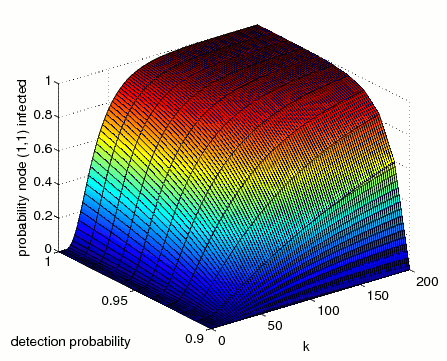
The minimum and maximum probability that the node at grid position (1,1) becomes infected within k steps.
The graphs below, presents results for the time bounded property as both the probability of detection and number of steps vary.
N=3 (minimum)
N=3 (maximum)
N=4 (minimum)
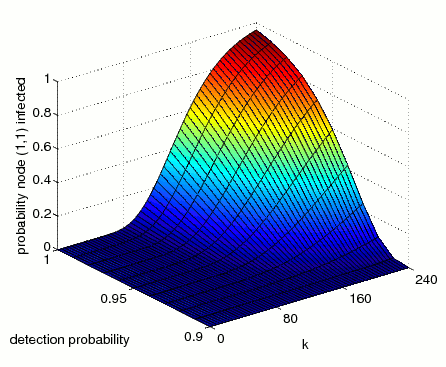
N=4 (maximum)
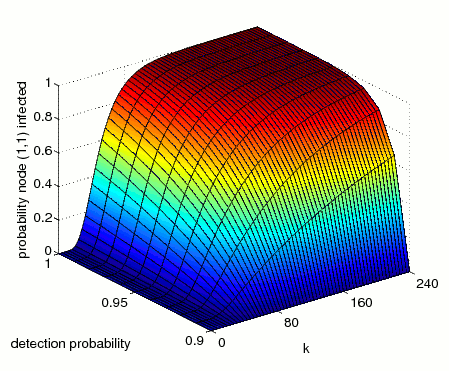
The difference between the minimum and maximum probabilities of infection is because the virus chooses nondeterministically which node to infect next, and in the maximum case the virus finds the quickest route to infect the node (1,1), while in the minimum case the virus attempts to infect all other nodes before infecting the node (1,1).
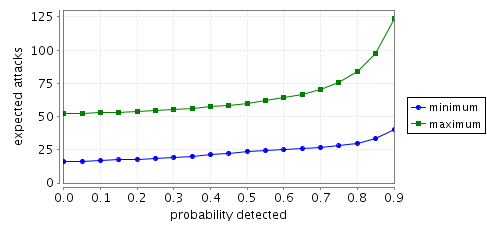
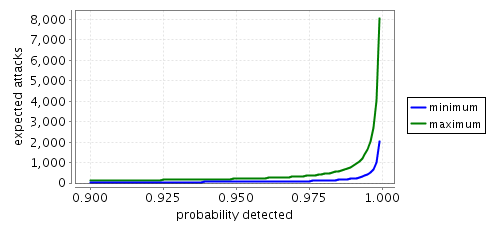
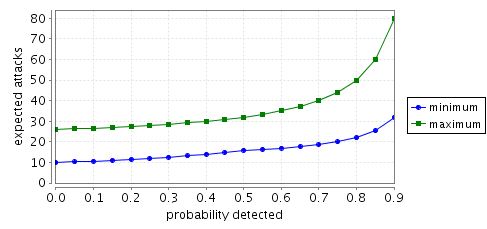
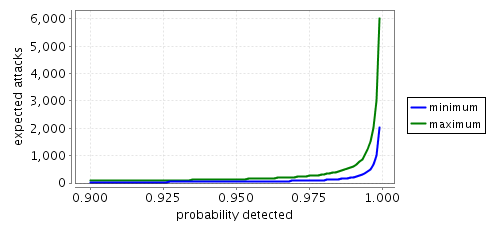
The minimum and maximum expected number of attacks until the node at grid position (1,1) becomes infected.
The graphs below plot the expected number of attacks until the node in grid position (1,1) becomes infected.
N=3
N=4